Dread January CPMs? Look what we found...

A Look at January CPMs

25.png
  • We observed CPM variability at the start of 2020. However, we predict that CPMs will level off towards the end of January and begin to steadily climb throughout the quarter resulting in YoY gains. Check out your STAQ Benchmarking dashboard here to see your CPM trend.

  • A positive sign for the quarter, CPMs surpassed January 2019's high earlier in 2020.

    • January 2019 hit $1.43 on the 26th, while January 2020 hit $1.54 on the 18th delivering an 8% increase YoY. We observed a CPM spike on the 18th across multiple partners and publishers.

  • Of our benchmarking partners, Facebook and Pubmatic reached or exceeded their 2019 CPM average early in January.

    • Pubmatic began the year with CPMs 7% higher than their 2019 average, while Facebook registered a 2% increase over their average in the first two weeks.

    • Interestingly, Facebook's revenue share was at 7% in December 2019, while their revenue share for this month is at 11% (similar to January 2019). If 2019 is any predictor, Facebook likely won’t maintain this level of contribution as the year progresses.


Brief Recap of Q1 2019 vs Q1 2018

  • Following a slow start to 2019, Q1 2019 ultimately delivered a 4% revenue increase and a 15% impressions increase YoY, while CPMs decreased 10%.

  • The number of partners producing over $100K per quarter grew from 31 to 37 YoY.

  • Mobile rose to 46% of revenue share, while Desktop lost declined. 

Question of the Week?

Who were the top 3 Advertisers of Q1 2019? To find out, click here to access your STAQ Advertiser dashboard.

If you have any trouble accessing or navigating your dashboard, please contact your Account Manager.

Week At A Glance

*  The data in this email compares programmatic industry performance across US only running through STAQ systems for January 2019 - January 2020 and excludes 2 outlier publishers

26.png

New Year, New CPM’s and a Wrap on Q4

The New Year’s Day CPM Trend
 

Over the past few years we’ve observed the lowest CPMs of each year on January 1st, which we’ve listed below.

23.png


Following a January 1, 2019 low of $1.18, we observed an immediate CPM growth through Q1. CPMs remained stable throughout the year at an average of $1.80 until Q4. With January 1, 2020 CPMs 12% higher than last year, we see this as an encouraging start to 2020.


Q4 2019 vs. Q4 2018

24.png
  • As anticipated, we saw a precipitous CPM drop after Christmas in 2019. However, this decrease was not as dramatic as 2018. New Year's Eve 2018 CPM dropped to $1.66 while 2019 remained around $1.80.

  • We’ve been keeping an eye on how the 6 less business days between Thanksgiving and Christmas would impact Q4, here’s what we’ve found:

    • October saw a 12% revenue increase YoY, an 8% impressions increase, and a 3% CPM increase. This may be attributed to an overall earlier start to the holiday shopping season. 

    • November experienced a 3% revenue decrease, and a 1% decrease in impressions and CPMs, while December registered a 5% revenue and impressions decrease, and a 1% increase in CPMs. 

    • Overall, Q4 2019 delivered flat revenue, impressions, and CPMS YoY.


* The data in this email compares programmatic industry performance across US only running through STAQ systems for October 2018 - January 2020.

All I Want for Christmas are STAQ's Advertiser Benchmarks

The Impact of Disney & Apple in 2019

20.png
  • Pharma displayed consistent growth in 2019, with a November increase of 54% over its yearly average.

  • Entertainment experienced a November peak that was 152% over its yearly average, likely driven by the release of Disney+.

  • Mobile & Wireless delivered an 80% November increase over its average. Revenue remained steady until September, which may be attributed to the release of the new Android and iPhone.


Opportunities in Private

21.png
  • From our dataset, we’ve observed that Target conducts the majority of its deals in Private Auction at much higher CPMs than Open Auction.

  • AT&T conducts 47% of its deals in Private Auction, but only at slightly higher CPMs.

  • Groupe Renault runs 32% of its deals in Private Auction at significantly higher CPMs.

  • Interestingly, one of the largest global advertisers conducts 24% of its deals in Private Auction but has higher CPMs in Open Auction. To find out more, contact your STAQ representative.

Growing DSPs

22.png
  • Verizon Media is experiencing significant growth in 2019, with November net volume ($) 50% over its average. 

  • The Trade Desk has consistently grown since July with November net volume ($) at 44% over its average. This is likely due to The Trade Desk’s general evolution of product this year.


If you haven’t accessed your advertiser benchmarking dashboard, please reach out to your STAQ representative to find custom insights you can leverage.  


Note on the data:
The data in this email includes ~ 40 publishers, 13 partners (SSPs), and 200+ top advertisers across 150+ DSPs running in STAQ systems from January 2019 to November 2019. The included partners have made significant investments in providing a wider dataset and higher levels of transparency. This data does not include endemic publishers who may skew the data.

Holiday Recap: 2019's Top Advertising Day Is...

Takeaways from This Holiday Season

18.png

Similar to last year, Cyber Monday (12/2) was the highest revenue day of 2019. Surprisingly, the day before Cyber Monday (12/1) was the second highest revenue day, and Black Friday the third.

  • Cyber Monday experienced 15% higher revenue than Black Friday, but 5% lower CPMs.

  • Comparing 2019’s Black Friday and Cyber Monday to 2018, we observed:

    • Black Friday 2019 registered a 4% revenue decrease over 2018 and a 2% CPM increase.

    • Cyber Monday 2019 saw a modest revenue decrease of 1% over 2018 with a 3% drop in CPMs.

    • However, Mobile is having a positive holiday season. Mobile experienced a 16% growth in revenue and impressions on Cyber Monday, and a 14% revenue increase coupled with a 21% impression increase on Black Friday.


Up Next: A Quarter to Date Deep Dive

  • So far, Q4 2019 delivered 3% revenue growth, 2% CPM growth, and flat impressions over 2018. However, given the late Thanksgiving, will this modest growth be sufficient for a positive Q4?

  • December 2018 saw a 5% revenue decrease driven by the typical post- Christmas decline.

Week At A Glance

19.png

Time to Ring the Cash Register

Takeaways from Last Holiday Season

16.png


In order to prepare for the 3 highest revenue days of the year, we took a look back on 2018’s holiday season.

Cyber Monday was the highest revenue day of 2018; Tuesday (the day after Cyber Monday) was the second highest; and Black Friday was the third.

  • Cyber Monday 2018 experienced a 13% higher revenue than Black Friday, but slightly lower CPMs.

  • Comparing 2018’s average CPM and average daily revenue to that of Black Friday and Cyber Monday we saw:

    • Black Friday delivered a 65% revenue increase over the average and a 48% CPM increase.

    • Cyber Monday registered an 86% revenue increase over the average and a 46% CPM increase.

  • So far in 2019, we’re seeing a positive trend in CPMs and are hoping to see CPMs reach 40% above the 2019 daily average on Black Friday.

  • Following Black Friday and Cyber Monday, revenue and CPMs declined in December but remained well above average until a few days before Christmas, when revenue and CPMs dropped steeply. This drop continued through New Year's.

    • We’ll likely see a similar drop this year. However, with Cyber Monday falling on December 2nd, the decline in revenue and CPMs will begin later this year.

Week At A Glance

17.png

A Polarizing Q4

Q4 Is All About November

Comparing this Q4 so far to that of last year, we’ve observed a 17% increase in revenue, a 20% increase in impressions, and a 2% decrease in CPMs. In aggregate, we’re seeing a successful Q4 with some publisher volatility across the board. However, with Thanksgiving falling later than last year, this November will miss out on 6 big revenue days. You may remember that we saw 2018 November’s revenue at 28% over October’s.


Surprising Publisher Impression Fluctuations YoY

12.png

We expected more consistency among our publishers when it came to impressions, but that is not the case. Comparing impressions from Q4 to the same time frame last year, we observed:

  • Many publishers experienced increases in impressions coupled with decreases in CPMs and vice versa.

  • Only 3 publishers saw both a major spike in CPMs and impressions YoY.

Partners’ (SSP) See Changes in CPMs

13.png

Comparing CPMs of partners’, we saw that some small partners’ experienced large increases in CPMs YoY while large and mid-size partners were more varied. We observed:

  • 4 partners, most with no scale, grew 50% in CPMs YoY. The one exception was Oath, which grew 50% plus.

  • Partners that offered both scale and big CPM increases include:

    • OpenX CPMs increased by 18% YoY.

    • Index Exchange CPM’s increased by 27% YoY.

    • Rubicon CPM’s increased by 21% YoY.


Large Publishers Winning With Private and PG

14.png

When comparing impressions by transaction type, we observed a significant increase YoY in private and programmatic guaranteed which has been driven by a handful of large publishers that average over a billion impressions a month. 

  • Open Auction experienced a 13% increase in impressions and flat CPMs.

  • Private is up 66% but saw CPMs dip by 25%.

  • Off of a very small 2018 base, Programmatic Guaranteed experienced a 146% growth in impressions and a 13% increase in CPMs.

A Note About the Data this Week

If you follow our emails closely, you’ll note that in our last email when looking at October revenue over prior year we saw only modest growth. We have since increased the size of our benchmarking pool and have excluded two publishers that were anomalies.

In addition, we excluded Amazon from this analysis. This is disappointing as this is the time of year we expect to see Amazon deliver their best revenue and CPMs. However, they have been unable to deliver consistent data in the past few weeks. We are hopeful they resolve this issue soon. Facebook has also been excluded. They do not provide a 12 month look back window, so we are left with the option of removing publishers who have been added in the past six months or removing Facebook :(

Week At A Glance


15.png

The Clocks Have Changed, Maybe Q4 Will Start Soon

Are We There Yet? Q4 to One Month into Q4

  • Comparing the first month of Q4 2019 to that of last year, we’ve observed that revenue increased by a modest 1%, impressions decreased by 5%, and CPMs increased by 6%.

  • The number of partners producing over $100K in October decreased from 28 to 25 YoY.

  • The average number of partners per publisher increased from 14 to 15 YoY.

  • There are six fewer days between Thanksgiving and New Year's.

A Modest Shift to Private

8.png
  • Open Auction experienced a revenue decrease YoY while Private and Programmatic Guaranteed experienced revenue increases.

  • Open Auction's revenue share thus fell by 6%, while Private and Programmatic Guaranteed both gained an additional 2% of revenue share. The remainder fell into "Not Available".

YoY Revenue Share by Partner

9.png

Big Changes in October 

  • AppNexus snagged 4% additional revenue share, while Rubicon gained by 2%.

  • AdX’s revenue share decreased by 3% and Amazon’s by 2%. AdX could be seeing an impact from their recent changes, but Amazon is surprising given their historical growth

  • AdX, AppNexus, and Rubicon delivered the highest revenues respectively in October 2019. This is a change from October 2018, where AdX, AppNexus, and Index Exchange delivered the highest revenues.


Biggest Revenue Winners YoY

  • Interestingly, of the partners that experienced revenue growth, most were mid-range to small partners.

  • TripleLift saw an 89% increase YoY

  • AppNexus saw a 43% increase YoY

  • Teads saw a 54% increase YoY

Only a Few Creative Sizes Stood Out

10.png

The 300x250 experienced a revenue decrease YoY across all devices, but magnified on desktop which is a trend we expect to continue.

  • As expected the 320x50 grew in line with Mobile.

  • Video/Overlay gained 4% additional revenue share, while 728x90 saw a 2% decrease.


A Quick Thanks And A Note On The Data
Our data has gotten stronger this year thanks to partners like AdX, Index Exchange, OpenX, and Criteo who have made significant investments in providing a wider dataset and higher levels of transparency. It is important to note that Facebook has been removed from this YoY view as they provide a lookback window of only 180 days and we have added many new Publishers in the past year.

Next up: A deep dive into CPMs.

Month At A Glance

11.png

Google's Switch To First Price Auction Part 2

Little Market Volatility, Lots of Publisher Volatility

When Google introduced first-price auction at 20% last Monday (9/09), there was surprisingly little variability in the market. This past week has been quite a different reality. After Google rolled out first-price auction at 50% on Monday (9/16), some publishers experienced significant gains in revenue while others experienced the exact opposite. When we looked at Monday’s data (9/16), and saw AdX revenue down 16% week over week, we thought this transition might get ugly; and for some, it still may.

4.png
5.png

STAQ is seeing modest growth in CPMs across all partners. This is consistent year over year when looking at 2018 for the same time period, further indicating that the overall market is relatively unchanged by this transition. That being said, we are seeing AdX revenue flat week over week, while all other partners (excluding AdX) experienced a small revenue growth.

For the week of September 16th (September 16 to September 22),

  • AdX CPMs were $1.34, up from $1.27 the week before; an increase of 6%

  • All other partners (excluding AdX) experienced an increase of 4% week over week, with CPMs at $1.54, up from $1.49.

  • All other partners (excluding AdX) experienced a revenue increase of 7%.

Publishers' See Varying September AdX Performance

6.png

Taking a closer look at how individual publishers were impacted, we have observed a marked variance week over week for AdX. 

  • Many larger publishers saw varying revenue decreases week over week.

  • Interestingly, mid-size and smaller publishers had a much lumpier experience on a weekly basis. Some experienced revenue increases greater than 30%, and others experienced revenue decreases of over 20%.

  • The net impact of these variances was slight growth in AdX CPMs but a flat AdX revenue week over week.

Overall, as first-price auction is rolled out at higher levels, we have begun to see variance in AdX performance for individual publishers. While we expect the market to stabilize, it appears it is moving in different directions for different publishers. As a whole, Google seems to be managing this market dynamic exceedingly well, unless you are one of the handful of publishers that are down. Interestingly, year over year, we're seeing that September CPMs are experiencing little movement but revenue is down. 

AdX At A Glance

7.png

Has Google Flipped the Switch?

Has Google Flipped the Switch?


September 10th marked the start of Google's full integration into first-price auction. Over the course of last week, STAQ heard that some publishers have been fully transitioned, while others are anticipating their switch. Given that Google is moving, in full, to first-price auction in September, we decided to see what effect this has had on AdX CPMs.
 

1.png
2.png


Looking at CPMs across all publishers, we see little to no variance; AdX CPMs are trending as expected for this time of year and mirror a similar trend seen in 2018 during this time period.

The highest negative variation from August to September was over Labor Day weekend, where we observed a 6% decrease in CPMs for AdX and all other partners (excluding AdX). Following this holiday dip, it appears that business is back to normal.

For the week of September 9th (September 9th to September 13th)

  • AdX CPMs were $1.27, up from $1.22; an increase of 4% week over week.

  • All other partners (excluding AdX) saw an average CPM of $1.47, up from $1.42; an increase of 3% week over week.

Today, no news is good news, as it seems that Google has been making sure that their major transition is as non-disruptive as possible. That being said, it is far too soon to make sweeping conclusions on the long term effects of Google's switch. STAQ will continue monitoring our data as the transition to first-price auction comes to a close over the next few weeks.

Have a theory, question, or data analysis you would like to see in our next email? Please reach out to your STAQ Account Manager. 
 

Week At A Glance

3.png

Are you a STAQ Benchmarking participant with a colleague that needs to see these emails?  Click here

* The data in this email compares programmatic industry performance, across US, open market inventory only, running through STAQ systems for January 2018 - September, 2019.

STAQ Handles Google's DCM Issues In Stride

Publishers were deeply affected when Google's DoubleClick Campaign Manager experienced API connection failures in late February. While Google was acknowledging the problem and promising a fix, STAQ was able to patch the issue and kept data flowing. Google was ultimately able to provide a fix.

Because STAQ handles data collections across for many publishers dependent on DCM, we were able to diagnose the problem and find a temporary solution while Google fixed it for the long term.

dcm.png

Team STAQ Raises Over $6,000 At Bowling For BreastCancer.Org

At the 10th-Anniversary event, team STAQ raised over $6,000 for Bowling For BreastCancer.org. We bowled our hearts out and had a blast. Thank you to our teammates and those who contributed to this amazing event. Bowling For BreastCancer.Org has raised over $4 Million to date for the world's leading online resource for breast health and breast cancer information and support.

BFBC.png

Q4 Top Of The STAQ Winner | Feifan Chen at Daily Mail

Our quarterly Top of the STAQ award is given to those who have shown extraordinary skills and effort in driving insights for their companies that increase performance and yield by leveraging automated reporting.

Presentation1.png

Our Q4 winner, is Feifan Chen - Manager, Global Commercial Data at The Daily Mail.

Feifan has leveraged STAQ to build out an incredible automated data set for The Daily Mail, spreading revenue driving insights across his organization. Since implementing STAQ to collect and unify reporting from their direct buyers, programmatic exchanges and analytics partners, The Daily Mail has seen a 250% increase in their revenue. Prior to this, reporting collection and analysis would take three hours a day and has since been reduced to 10 minutes - enabling their business teams to instantly receive the insights they need.

With the success of this approach in the U.S., This top 50 ComScore brand with over 200m unique visitors has adopted this data strategy globally, across the U.K., AU. and the rest of the world. Congrats Feifan!


The State Of Programmatic CPMs - An Analysis

At AdExchanger’s Programmatic IO on October 15th in NYC, Matthew Goldstein presented an overhead analysis of the industry utilizing an anonymized data set fueled by’s STAQ Industry Benchmarks product. This compelling analysis covers the industry’s most important metrics, including the average CPMs of ad sizes, the performance of desktop over mobile, the market share of largest exchanges and much more!

STAQ’s Industry Benchmark product enables publishers to compare their own performance against the performance of their peers. With over 20 brand name publishers and $500m in annual revenue, this massive collection of data reveals incredible insights into the industry and can guide publishers to higher revenues!

Click Here To Download The Presentation

Top Of The STAQ Award - Q2 2018

IMG_9209_jpg.png

Our quarterly Top of the STAQ award is given to those who have shown extraordinary skills and effort in driving insights for their companies by leveraging automated reporting.

This quarter's winners have not only skillfully reigned in the firehose of reporting data that their companies collect on a daily basis, but have also unpackaged specific insights which directly impacted their bottom line revenue.

We're very excited for this quarter's winners and congratulate them on their hard work...


Justin Hansen, Yield Manager

Intermarkets - Reston, Virginia

large_IMKLogo-1.jpeg

Justin and the team at Intermarkets have an incredible skillset in utilizing automated reporting for media optimization. So it was of no surprise to hear that Justin was able to double the CPM of one of their websites in less than a month! Intermarkets handles a large portfolio of brand web sites, serving over 3 billion impressions a month across all screens.


Joy Bian, Platform Specialist

33 Across - New York, NY

Joy Bian streamlined the reporting process for the sales & operations teams at 33 Across, enabling an astonishing 3X ROI on the investment into reporting automation. 33Across delivers deep engagement and increased ROI for buyers with their Attention Platform™ product and a unique monetization solution for publishers that has been named "Best Publisher Technology" by Digiday.

Congratulations Justin and Joy!

33across_Logo540x180.png

Remember: We Are Not A Real Time Industry.

In our industry, we all base our operations and finances of what is reported in a static UI at the end of the day as the billable number, not a real time auction price.

Yes, there are real time auctions, but the actual payment on these auctions change afterwards in reporting from both the buy and sell side, and from 3rd parties.

Nearly ALL of the ad tech revenue that is billed is reported by the buyer to the DSP, exchange and the end publisher, based on what the buyer displays in their reporting UI or what their verification partner clears as valid. All of this is well after the real time auction is complete. And this reporting changes even after it is published, often it will change many weeks afterwards.

Why and how can billable reporting change?

The IAB industry standard has had the buyer with audit control over payments. This came from a need to control of the performance and fraud that our wild west industry was plagued with in the beginning. The buyer has a right to check and determine the performance of the inventory they bought after the auction and change the publisher’s payment if they see any of the traffic they bought was:

  • Not from a human

  • Not “in view”

  • Not within the audience they contracted for

  • Not within the content (or placements) they contracted for

To determine the above, it takes investigations, 3rd party verification companies, changing databases and re-posting reporting counts. All of this happens frequently on any normal day or week.

This past year, there have been calls for more transparency for both sides with news on baked in buyer fees, auction adjustments, and demands for 100% “in view” on human traffic only.

All of these items have been already baked into the numbers in available reporting. I’m not saying any of these practices are right... or misleading. That’s up for you to decide as a buyer or seller.

But in the end, the reporting inside partner interfaces at the end of the month are the numbers in which we run our businesses. As long as our campaigns need to be recalibrated and adjjust our inventory based on daily reporting changes, we are not real time.

-James

James Curran

Co-Founder & CPO

Top Of The STAQ Award

Announcing The First Winners Of The "Top Of The STAQ Award"

We’re happy to announce the Top Of The STAQ Award. This award was created to recognize innovative STAQ users across our global client roster. We are privileged to work with so many people who use STAQ every day to improve their company’s insights, revenue growth and profitability.

Inbox__35_923__-_james_staq_com_-_STAQ_Mail.png

The first round of winners were difficult to choose. All of the nominees are experts in automated data and reporting, showing effort and skill when building and maintaining their STAQ accounts, leveraging the product to the fullest extent and working to build an incredibly valuable automated data solution for their companies.

The winners have exceptional examples of using the STAQ product against their organization's unique business needs and conditions through:

 - Showing clear improvements to their organization's business

 - Organizing their data for their company's unique purposes

 - Applying creative ideas at the nexus of data and media to create insights that have driven results


....And our first winners are:

Bud Johnson - HealthGrades

Walter (Bud) Johnson is an experienced data operations professional that took STAQ’s capabilities to the next level. He took advantage of STAQ’s flexible reporting UI and created custom reports to meet HealthGrade’s needs.

Through the implementation and usage of STAQ, Bud Johnson created insights that cut HealthGrade's buffering levels in half and increased availability of inventory by 17%, by connecting 1st party ad server data with 3rd party and 4th party verification tools. Their Sales teams are now able to sell a higher volume of inventory as a result of these insights.

 
logo-v2-blue.jpg

“Bud just knows how to use the data. He has a vision for how he wants to see his organization use the platform” - Ryan Weber, STAQ

Accu.jpg

Steve Mummey - AccuWeather

Steve Mummey has leveraged both his technical knowledge and data analytics experience as well as a passion to carry the flag across projects in Accuweather. His skill set includes front-end HTML, JS and CSS development/maintenance, SEO strategies and tactics, general analytics and reporting, advertising integration with DFP, project management; team lead and liaison between external firms, consultants and internal stakeholders.

Steve created a Programmatic Forecasting Report with STAQ which allowed him to see AccuWeather's actual revenue on a daily basis against the budgeted revenue, enabling the organization to see their pacing against forecasted revenue. Then using historical data to compare the current month revenue to last year's revenue, the company is able to watch their performance for year over year, on a daily basis... all with complete automation.

“Not only does Steve do an exceptional job optimizing programmatic and direct for AccuWeather, but he's not afraid to get into the weeds, and he continuously finds new way to present the data to his organization.”  - Zach Root, STAQ

- Criteria for the awards are based on knowledge and ability to unify the automated data sources flowing into STAQ, time and usage of the platform, as well as the operational efficiencies and insights they have brought to their organization as a result of their work. 

Congratulations Bud and Steve!

-James Curran, STAQ Co-Founder

Don't Drown While Filling Your Data Lake

Publishers are starting to ramp up their investment in data, especially as they gain more prowess in programmatic advertising. Many are throwing around the idea of creating their own data warehouse.

Data is currency. Amazon uses data to give you a more relevant retail experience. Google uses data to organize all of the information on the Internet. Facebook uses data to map your social behavior (sometimes they wind up in trouble.)

Publishers need to determine what they want to use data for, and also if they have the resources to collect, review and manage that data well enough for an investment in a warehouse to be worthwhile. Otherwise, a data warehouse ends up more like a data lake, with quicksand at the bottom.

Avoiding_The_Pitfalls_Of_Building_A_Data_Lake_-_Google_Docs.png


Focus on The Goal

Data can be currency, but every data point isn’t valuable enough to keep. Thinking that you should simply collect and park every data point that comes into your organization is bad idea. Storing it will be expensive. You will have trouble squeezing insights from a huge data set. And you run a bigger security risk. It’s highly unlikely that this scenario will reap you enough long term reward to overcome the early problems.

Instead, start with a clear goal, and focus on the data points that help you reach your goal. You might have a goal to normalize pricing across your inventory based on advertiser bidding patterns. In that case, you would focus on collecting real-time bid stream data from your demand partners. Or, you might be interested in understanding the market value of various pieces of advertising inventory on your website cross-analyzed with different audience groups. So you’d need a solution that merges data from your DMP and your ad servers. Every business problem is different, and so every data warehouse should look different.

Keep Your Head Out of the Clouds, Even if Your Data Is In the Cloud

Think of a data warehouse like a real brick and mortar building that will store your stuff. You need a clean, safe, secure storage facility. You need to be able to grant access to certain people and restrict other people. Trucks need to be able to pull up and drop data off at regular times, and you need to find a place to put incoming data that’s organized and works with what’s already there.

For publishers with limited resources, these responsibilities might stretch beyond the reasonable limits of their organization. Don’t let developer hubris get in the way of a prudent decision. You probably do not need your own servers or your own room in a custom data center. Amazon, Microsoft Azure or Google Cloud will likley end up being the best partner because they are a relatively full service and that’s OK. The most important points to cover are that your data is secure, organized and accessible, and can accommodate the influx of new data without becoming unmanageable.


  • Log level data

  • Try to get a sample if you can to understand how to answers the question below: (crazy if you are multiple pubs, not as bad but still sucks if you’re single…. Because is based Custom content key value pairs, or Audience Key Values)

  • Be aware that the amount of data is exponentially more than rolled up data most digital publishers and marketers are collecting and analyzing on their own.

  • A roll up strategy is needed to handle it. For example when you have this data, what do you plan on looking for / getting out of it.

    • Do you need to see Bids, by Page or Content

    • Do you need to see Clearing price by Advertiser or Exchange

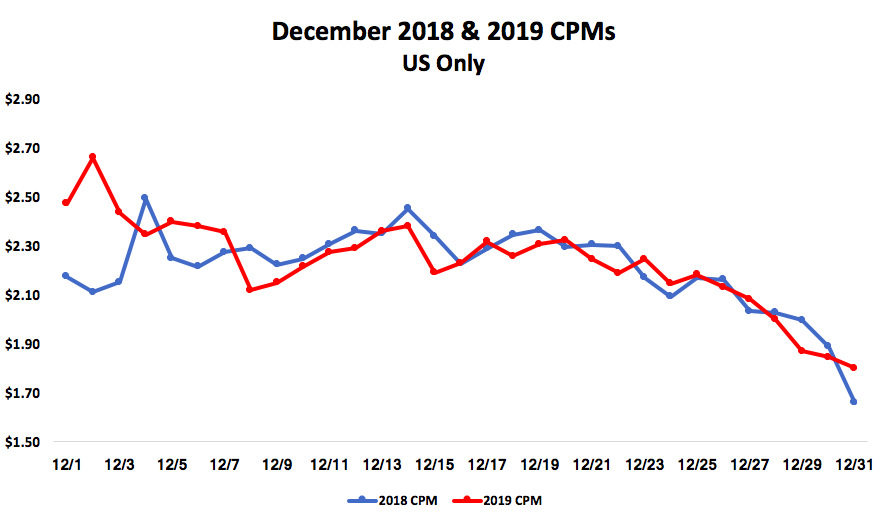
    • Do you need to see certain fluctuations by Time (meaning holidays and day of week)


Only when you roll it up, can you actually use it. If you can’t answers questions from it, then be careful collecting this data until you have at least figured out your top 3 questions.

  • And can you act on this when you have it????

Do you raise floors during winter if your content gets higher bids in sick season?

Do you change Guar. direct advertiser CPMs before this season?

The Opposite of Set It and Forget It

Speaking of unmanageable, data has a habit of spinning out of control, and you’ll need a lot more than an organized warehouse to keep it in shape. Taking the programmatic example, every day, a typical publisher pulls data in from 10, 20 or 30 different data sources and every day, there are errors in that data. You’ll need to have the resources to address errors within millions or billions of data points before you simply back up the truck and dump the info into your warehouse. On top of that, APIs stop working, field names change, partners change their policies, and you need to be on top of every minute change or you fall victim to the “garbage in, garbage out” problem. At that point, your entire warehouse is compromised.

This is where the warehouse analogy really matters. There is no brick-and-mortar warehouse that sits unattended where trucks simply back up and dump merchandise. There are people managing which door the trucks come to, people driving the forklifts, people checking, recording and cataloguing each delivery, and janitors keeping it clean. These labor costs are well understood in the world of physical storage, but are often dangerously neglected in the world of data.

I know of one publisher that put all warehouse management responsibility on a single person. When that person left the company, their data warehouse did sit unattended as tons of data piled up. Their storage costs and risk piled up, too. It was several months before the finance department noticed the mounting costs and figured out where they were coming from.

The moral of the story is that collecting and storing data is complicated. It requires a plan and goals, management and oversight. Otherwise, all your valuable insights will be sucked into the quicksand at the bottom of the lake.