HBO MAXimizes, Biden Spends, CPMs & Revenue Pop

bd488021-85f4-4c05-8d63-ac742807e5fd.jpg

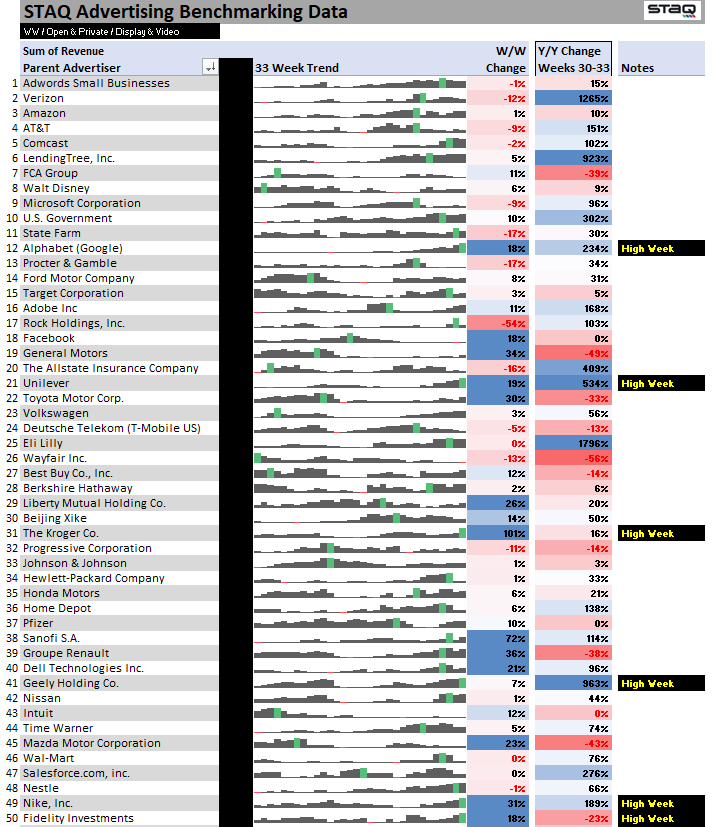
A Note About the Data: We have been sharing YoY shifts in advertiser spend on a rolling four week basis. Given some of the impressive gains when looking at advertisers like Lending Tree, we want to contextualize these trends relative to the larger dataset and market. For all of the large gainers, there are large decliners as well. The view we share via email contains only the top 50 advertisers who: may have a different product suite to market in the prior year, have recently made a move towards or away from programmatic and we are seeing a resulting share shift, or like many others may be responding to Covid by increasing or decreasing spend. The grand total at the bottom represents the entire Advertiser dataset.

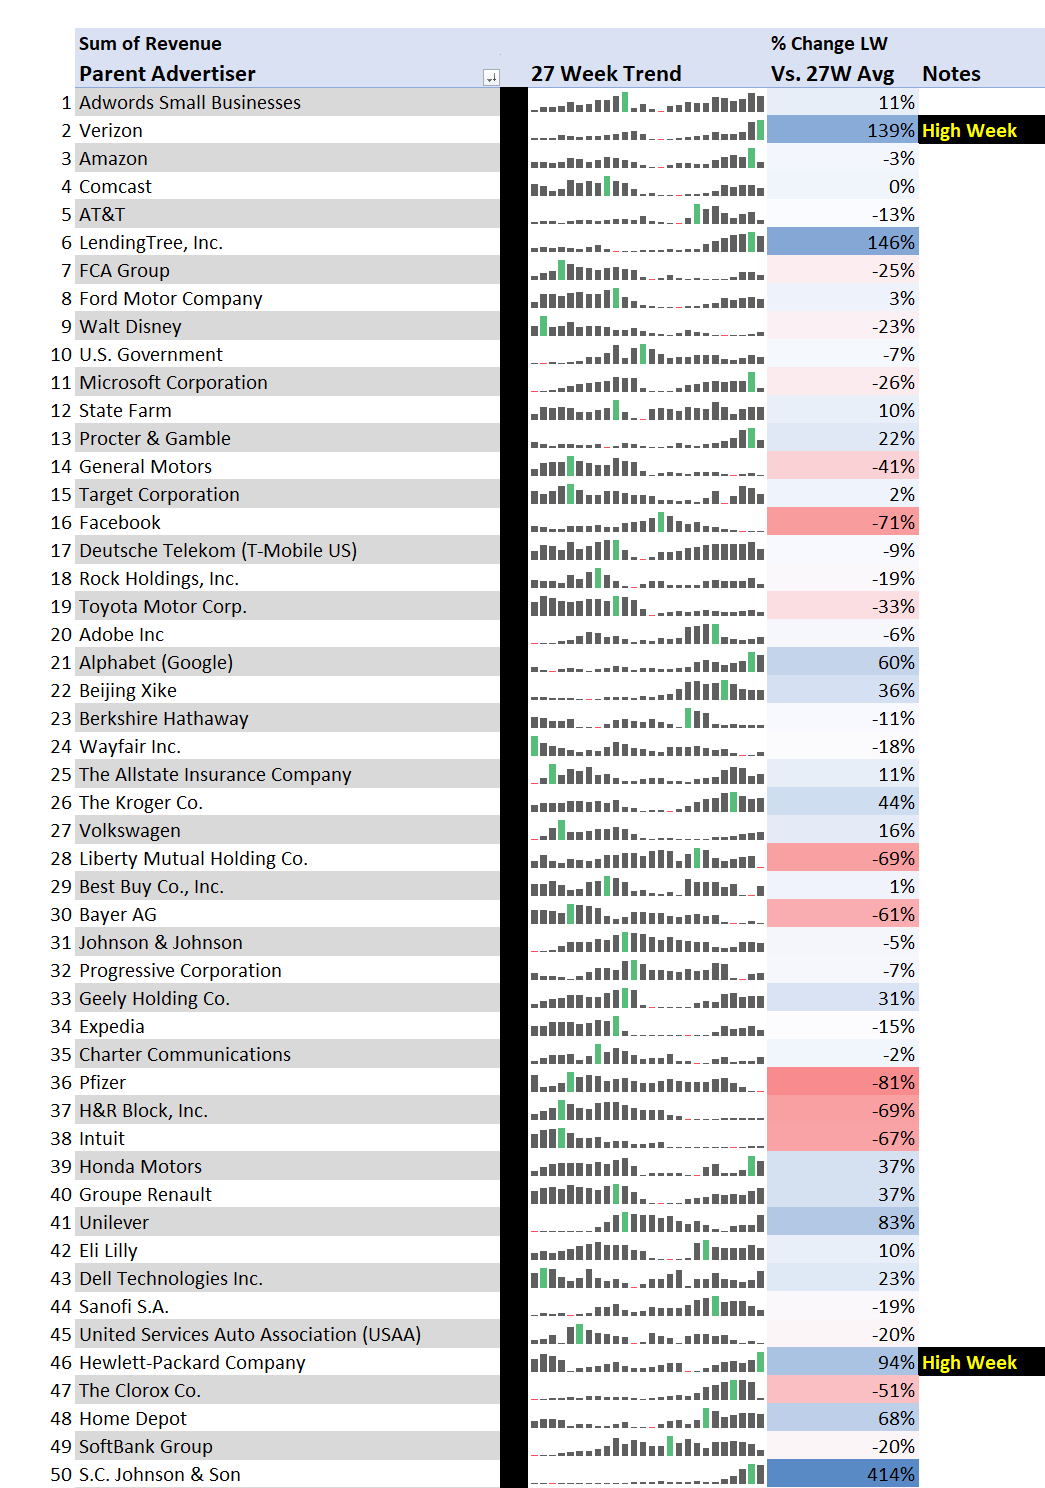
To provide a more comprehensive view, an expanded list of the Top 100 advertisers is below.

Advertiser Data: Biggest Movers

Week 37 had the highest CPMs of the year so far and Revenue up 13%YoY! While this week does encompass part of the slower Labor Day holiday, we saw 27 of the Top 50 advertisers up W/W. Political advertising is starting to pop with Biden and the DNC registering spend. As a baseline is established, we will continue to call out political spend in the weeks to come.

Special Report Available Next Week: Head Start On Q4, A Look At 2019 Top Q4 Advertisers

At A Glance: 

  • Keep on streaming. Time Warner up 14% W/W hits its highest week of the year driven by HBO Max.

  • After a slow 4 weeks, Verizon up 39% preceding their TracFone announcement this week or maybe ramping up competition with AT&T again.

  • FCA, Ford, GM, and Volvo (Geely) all up this week driving gains for Vehicle brands. 

Below is a view of the top 50 advertisers, based on spend. The right column compares Y/Y trends of the 4 week average of Weeks 34-37 2020 vs 2019. The left column compares W/W trends from Week 37 vs Week 36.

The Grand Total represents the entire Advertiser dataset.

Top Gainers and Decliners

Top 50 Weekly Gainers & Decliners 9.9

bd488021-85f4-4c05-8d63-ac742807e5fd.jpg

Advertiser Data: Biggest Movers

Week 36 displayed slower advertiser spending associated with the Labor Day Holiday and opportunities to enjoy the outdoors. 74% of the Top 50 advertisers were down on a W/W basis.

We did see positive trends with Back To School, but we will have to wait until next week to see which large and consistent advertisers return post holiday. We expect things to pick up, and Mid-September to be strong.

At A Glance: 

  • Big week for Mickey+. Disney up 52% with the anticipated release of Mulan. They are driving the Entertainment category up 33% W/W.

  • BTS and virtual learning helped drive Consumer Electronics to its highest week of the year. Best BuyHP, and Samsung all up over 20% W/W. 

  • After Verizon and AT&T spending big for much of the year, T-Mobile coming back up 119% W/W and their highest week of the year. 

Below is a view of the top 50 advertisers, based on spend. The right column compares Y/Y trends of the 4 week average of Weeks 33-36 2020 vs 2019. The left column compares W/W trends from Week 36 vs Week 35.

Top Gainers and Decliners

Picture1.png

Weekly Advertiser Gainers & Decliners 8.25

bd488021-85f4-4c05-8d63-ac742807e5fd.jpg

Advertiser Data: Biggest Movers

Week 34 continued to display interesting August trends, with CPMs increasing over the last 4 weeks, and displaying their highest week of the year (so far). We anticipate News publishers could make up for volatility earlier in the year with Politics looking to ramp up post Labor Day. 

Keep an eye out for our next newsletter the week of 9/7. We hope everyone enjoys their Labor Day!

At A Glance: 

  • Following up on last week’s return of AmEx for the first time since Q1, they are up a significant 168% W/W. Along with Wells Fargo and Fidelity, they are driving the Finance category, all with their highest weeks of the year.

  • Pfizer & J&J with a possibility of green light on a Covid vaccine. Will these big advertisers break the top 10 before end of year? Or will there be little need to promote what we all want? 

  • Food & Grocery, Beverages, and TV & Video all down over 20% this week. Perhaps waiting for consumers to return from summer vacations and begin the school year. 

Below is a view of the top 50 advertisers, based on spend. The right column compares Y/Y trends of the 4 week average of Weeks 31-34 2020 vs 2019. The left column compares W/W trends from Week 34 vs Week 33.

Top Gainers and Decliners

825.png

Top 50 Weekly Gainers & Decliners 8.11

89e32bf3-57b6-44d4-af81-f4747efe98c1.png

Advertiser Data: Biggest Movers

You can view this week’s Top 50 Advertisers Gainers and Decliners chart here. The right column compares Y/Y trends of the 4 week average of Weeks 29-32 2020 vs 2019. The left column compares W/W trends from Week 32 vs Week 31.

At A Glance: 

  • 36% of the Top 50 are up well over 100% Y/Y, lending credence to the theory that advertisers need to play catch up by spurring sales.

  • Lending Tree, Verizon, Eli Lilly, Geely (Volvo), all up over 1000% Y/Y, and contributing significant spend.

  • Wells Fargo is up 46% this week. However, they are down 43% Y/Y after being surprisingly absent recently. 

111.png

Top 50 Weekly Gainers & Decliners 8.4

bd488021-85f4-4c05-8d63-ac742807e5fd.jpg

Advertiser Data: Biggest Movers

Week 31 displayed steady revenue trends led by Finance, Pharma, Apparel, Entertainment and Software all showing low double digit gains over last week. We saw Government, Internet & Telecom, Conglomerate, and Wireless all declining on a Week over Week basis. That said, the week showed continued momentum compared to the first half of July. And we expect the trend to continue into August.

But first a brief note about Facebook: We looked at the advertisers who participated in the Facebook ban to see if there was a shift in spend towards Programmatic. We placed this subset of advertisers in their own category during the month of July. While we did see total spend within this category up ~3%, there was not a significant variance from the overall dataset which was up ~6%. Therefore, it does not seem that our publishers were the direct beneficiaries of the shift in ad spend.

At A Glance: 

  • After dominating the Finance category over the last 10 weeks. Likely driven by low interest rates, Lending Tree finally has buying competition with Rock Holdings (Quicken Loans). They are up 92% W/W and moved up to the 16th spot.

  • Getting creative again. Adobe up 29% W/W after a slow 10 weeks. The market is ripe for their Creative Cloud with Back To School and continued WFH.

  • Peacock driving Comcast to their highest week of the year, up 10% W/W.

  • Other notable gainers: Kohl’sGap, and McDonald’s with their highest weeks of the year and a good sign for Retail and Restaurants.

Below is a weekly view of the top 50 advertisers, based on spend. The right column compares Y/Y trends of the 4 week average of Weeks 28-31 2020 vs 2019. The left column compares W/W trends from Week 31 vs Week 30.

Top Gainers and Decliners

84.png

Top 50 Weekly Gainers & Decliners 7.28

bd488021-85f4-4c05-8d63-ac742807e5fd.jpg

Advertiser Data: Biggest Movers

Week 30 showed some of the best signs that advertiser spending and confidence has returned. With revenue up 13% overall, and 10 of the Top 50 advertisers having their highest weeks of the year, we are hopeful these are signals of a strong Q3/4.

As we came upon our 15th Advertiser Report, we continued to strive for the best way to provide you with the most actionable and strategic view of this data. In an effort to deliver maximum value we have changed things up a bit. Our new views of the Top 50 advertisers spending right now are explained below. 

Below is a weekly view of the top 50 advertisers, based on spend. The right column compares Y/Y trends of the 4 week average of Weeks 27-30 2020 vs 2019. The left column compares W/W trends from Week 30 vs Week 29.

At A Glance: 

  • Road trip! 8 Auto advertisers in the Top 50 up W/W finally showing the category growth we’ve been waiting for. Nissan continues their upward trend with a 93% increase this week.

  • This round is over. After duking it out over the last few months, Verizon continues to have a strong presence in the market up 25% W/W, while AT&T has been noticeably absent in programmatic the last few weeks. 

  • Expedia up 20% W/W as they aim to gain share and loyalty. 

  • The mind of Bill Gates... Microsoft, a usually consistent spender, declined over the last 3 weeks before returning this week up 12%.

  • As competition pushes spending, HP & Dell up over 25% W/W and having their highest weeks of the year.  

  • Wells Fargo returns to the Top 50 for the first time in 6 weeks and up 78% W/W with its highest week of the year.

Next Up: Our 1H 2020 Report will be released this week. Please keep an eye out for our recap analysis. We hope you like it!

If you’d like to check out other STAQ resources and reports, you can find them here. We will continue to add new content, so keep checking back!

Top Gainers and Decliners

7.28.png

Weekly Advertiser Gainers & Decliners 7.14

000 (1).png

Advertiser Data: Biggest Movers

Week 28 returns to the positive revenue trends we observed at the end of Q2. While we continue to see increased spending from some of the consistent advertisers, the overall start to Q3 is a bit choppy. Trends should become more clear with next week's data.

At A Glance: 

  • It's a small world after all. Disney up 23% and spending at pre-covid levels as the parks reopen. However, they are still down compared to where they were in January & February.

  • Groupe Renault up 56%, with Ford and Volkswagen also continuing their upward trends that began over the last few weeks.

  • Lending Tree up another staggering 209% having their (7th) highest week of the year. They have become the 5th largest spender in our dataset.

  • HP up 154% and Dell up 46% with their highest weeks of the year. 

  • Notable decliners: Microsoft, P&G, Facebook, Bayer, and Pfizer having a slow start to the quarter all with their lowest weeks of the year. 

Next Up: Our 1H 2020 Report will be released in the next 2 weeks. Please keep an eye out for our recap analysis.

As we make our way into the 2nd half of the year, we understand the importance of evolving our metrics for this report that will make the data more actionable. We will release further details and, hopefully, a new format next week.
 

Below is a weekly view of the top 50 advertisers, based on spend. The right column compares last week to the average of the last 28 weeks.

Top Gainers and Decliners

7.14.png

Weekly Advertiser Gainers & Decliners 7.7

000 (1).png

Advertiser Data: Biggest Movers

Week 27 crosses Q2 and Q3 and encompasses the (generally outdoors) July 4th holiday. Some advertisers continued to have strong market presence, however overall we observed typical Q3 drops attributed to exiting a quarter into a holiday weekend. 

As this week doesn’t paint a full picture, we won’t have a good read on Q3 until next week.

Additionally, we are keeping an eye on how the Facebook ban will impact a shift in paid media to the programmatic market and hope to have more meaningful data on this next week as well.

At A Glance: 

  • Notable decliners: Microsoft, T-Mobile, Clorox, and Liberty Mutual following a trend that most advertisers are showing as they enter the new quarter and holiday.

  • With their relevant product mix, SC Johnson (Saran, OFF!) up a massive 414%, the largest increase this week. 

  • Verizon up 139% and HP up 94%. Both with their highest weeks of the year, and continuing trends of heavy spending relative to the rest of the market.

  • Not throwing away their shot, Disney saw a large increase with the release of Hamilton. However, they are still down from what they were spending earlier this year. 

  • Lending Tree up 146% continuing its substantial marketing efforts. They are one of the largest advertisers we measure and should be in the top 5 by next week.

THIS FRIDAY: Mondelēz will be joining the next Insights by STAQ presentation July 10 at 1:15pm EST to talk about a Marketer’s Perspective, and The Path Through 2020. Register Here.

Below is a weekly view of the top 50 advertisers, based on spend. The right column compares last week to the average of the last 27 weeks.

Top Gainers and Decliners

7.7.png

Weekly Advertiser Report 6.30

000.png

Advertiser Data: Biggest Movers

Week 26 shows some of the strongest signs of recovery we’ve seen with 10 of the Top 50 advertisers experiencing High Weeks, up from 3 last week. We observed increased growth from consistent advertisers, and the return of absent ones to the market. (And not shown here, CPMs are up as well!)

Whether this is a result of typical seasonal spending, or an opportunity to make up for lost gains remains to be seen. Nevertheless this is welcome news heading into Q3.

At A Glance: 

  • Consistently a Top 15 spender, Microsoft up 99% with its highest week of the year.

  • Honda up 79% with their highest spending week of the year, and showing gains for the first time since early June. 5 Auto advertisers are up this week, and will most likely continue through the Holiday weekend.

  • Lending Tree jumps into the Top 10, up 244% and having its sixth consecutive highest week. 

  • Diageo who’s been mostly absent from the market, up 596% with its highest week of the year. Pernod Ricard also up this week. Is it the typical July 4th Holiday or are we seeing the ultimate in targeting and they know we collectively need a drink? 

  • Other notable movers: McDonald’s up 174% and Lenovo up a massive 603%, both increasing spend by 10x over the last 4 weeks.

First Look: Mondelēz will be joining the next Insights by STAQ presentation July 10 at 1pm EST to talk about a marketer’s perspective, and the path through 2020. Register Here.

Below is a weekly view of the top 50 advertisers, based on spend. The right column compares last week to the average of the last 26 weeks.

Top Gainers and Decliners

46.png

Weekly Advertiser Gainers & Decliners 6.23

000.png

Advertiser Data: Biggest Movers

After months of volatility, Week 25 shows the positive upward trends we’ve been waiting for.

While category movement has been the recent story, the return of some bellwether brands is finally driving significant momentum. Whether these spend levels are sustained remains to be seen, but we will take this as good news heading into Q3.

At A Glance: 

  • The biggest advertiser we’ve had our eye on to return is finally coming back. FCA is up 11%, and spending for the first time since March. This may be a response to Ford, also up, increasing over the last couple of weeks. Including Volkswagen, 3 Auto advertisers in the Top 50 are up and hopefully they will continue to try to make up for lost ground through the summer. 

  • In a welcome return, McDonald’s up 88% and spending for the first time since pre-Covid. They’ve been a surprisingly absent advertiser given their social distance set up with drive thru and take out. We’ve been awaiting this return as another positive sign for recovery, and expect other QSR’s to follow suit. 

  • Consumer Goods up 163% with their second highest week of the year in a row. This is led by an increased spend of Proctor & Gamble, Clorox, and SC Johnson, all experiencing over 100% gains this week.

  • Retail Trade up 35% with its highest week since March. These gains are led by Target, Wal-Mart, Kohl’s, and Walgreen’s. After being mostly dormant in 2020, Walgreen’s is up 236% showing real spend for the first time this year.

Below is a weekly view of the top 50 advertisers, based on spend. The right column compares last week to the average of the last 25 weeks.

Top Gainers and Decliners

Weekly Advertiser Gainers & Decliners 6.16

000.png

Advertiser Data: Biggest Movers

Below is a weekly view of the top 50 advertisers, based on spend. The right column compares last week to the average of the last 24 weeks, which is the metric we use for analysis unless otherwise noted.

Good news this week, revenue and CPMs are on an upward trajectory again. However, specific advertiser moves are inconsistent and hard to decipher. Some Q2 mainstays, like State Farm and Adobe, are pulling back. Whether they maintain their lower spend levels remains to be seen.

At A Glance: 

  • Consistently a Top 5 spender, Amazon up 33% with its highest week of the year.

  • Lending Tree up 216% having its highest spend for the fourth week in a row. If they continue on this path, they’ll likely break the Top 10 by next week.

  • Consumer Goods up 103% led by the continued spend of Proctor & Gamble, SC Johnson, and Clorox which is up 184%. They all had their highest weeks of the year.  

  • Retail Trade up 23%. The positive gains are driven by the return of Wal-Mart and Kohls up 284% with its highest spend of the year. As shoppers return, so do the advertisers.

  • Surprisingly, Allstate is back in the top 50 and up 64% while the rest of the category is down for the first time in 5 weeks.


Webinar THIS THURSDAY June 18 at 10:30am EST: State Of Digital Advertising: Where We Are, And The Path To Q3. Register here.


Top Gainers and Decliners

44.png

Weekly Advertiser Gainers & Decliners 6.9

Advertiser Data: Biggest Movers

Below is a weekly view of the top 50 advertisers, based on spend. The right column compares last week to the average of the last 23 weeks, which is the metric we use for analysis unless otherwise noted.

After 3 weeks of steady revenue increases, we have seen the market pull back over the last week. The advertiser shifts are likely due to the protests. It is clear that many advertisers may not know how to respond, don’t have appropriate messaging, or are choosing to avoid the content.

That said, we’ve seen spend return from advertisers who have been absent since March. We anticipate this may prompt a return from the other key spenders in those categories.

At A Glance: 

  • Ford up 7% with its largest gains in the last 11 weeks. Mazda rose 22%, increasing for the second week in a row and likely breaking into the Top 50 by next week. Nice to see positive signs from Auto, and hopefully this initiates spend from FCA and the rest of the category.

  • Expedia up a welcome 37% and gaining for the second week in a row. It will be great if others like Marriott follow their lead. Who’s looking forward to travel (advertisers) again?

  • Lending Tree up 187% having its highest spend for the third week in a row. Looks like they have found a way to capitalize on the current landscape.

  • Some consistent spenders declining this week are: Adobe, Target, Wells Fargo, Apple, Capital One, and Unilever who had their lowest week of the year. We expect this is a result of current affairs.


Webinar THIS WEDNESDAY June 10 at 12pm: How Publishers Can Generate Ad Revenue Now! Andy Ellenthal will be joined by speakers from Duration Media, Pubmatic, and Confiant, to discuss actionable ideas that help to drive revenue for publishers. You can register here.  


Top Gainers and Decliners

43.png

Weekly Advertiser Gainers & Decliners 6.2

Advertiser Data: Biggest Movers

Below is a weekly view of the top 50 advertisers, based on spend. The right column compares last week to the average of the last 22 weeks, which is the metric we use for analysis unless otherwise noted.

We have seen 3 consecutive weeks of revenue increases with several categories moving in an upward direction. We expect the trends to continue, but it is hard to anticipate how the events that transpired this past week will impact advertiser behavior. Regardless, we hope the outcome is positive lasting change.

At A Glance: 

  • Mobile & Wireless up 70% led by the continued spend of Verizon, AT&T, and T-Mobile. Verizon was up 47% with their highest spend of the year.

  • Progressive up 24% continuing the trend of consistent spend we have been seeing in the Insurance category. They are still far from State Farm who just had their highest week of the year.

  • Lending Tree up 174% having its highest spend for the second week in a row. Looks like they’re on their way to being a top 5 spender.

  • Honda, gaining over the last 2 weeks, is up 24%. Mazda is up a big 136% but is still ranked 95 in spend. It would be great to see FCA back, notice they are still ranked number 5 with almost no spend in the past 10 weeks.

  • In a surprise return for Travel, Expedia up 703% and Choice Hotels up 247% W/W. Giant movement off of a tiny base of spend, but it is encouraging to see. 

TWO webinars to note:

THIS Friday June 5 at 11:30am EST, we will continue our analysis of relevant trends from Industry and Advertiser data. We will also hear insights from publishers, and what strategies they've been taking. You can register here.  

Wednesday June 10 at 12pm, Andy Ellenthal will be joined by speakers from Duration Media, Pubmatic, and Confiant, to discuss actionable ideas that help to drive revenue for publishers. You can register 
here 

Top Gainers and Decliners

42.png

Weekly Advertiser Gainers & Decliners 5.26

Advertiser Data: Biggest Movers

Below is a weekly view of the top 50 advertisers, based on spend. The right column compares last week to the average of the last 21 weeks.

The most noticeable trend this week is overall category movement instead of specific advertisers. Is this a result of “follow the leader”, or a semblance of normalcy returning to the market?

At A Glance: 

  • The Mobile & Wireless category having another big week. Up 48% led by AT&T, Verizon, and T-Mobile.  

  • Software continues to show significant gains, dominated by another huge week for Adobe and their Creative Cloud, as well as Microsoft.

  • Pharma growing with Eli Lilly and Sanofi having their largest gains of the year. GSK who’s noticeably absent fell out of the Top 50 this week. 

  • Insurance up. Driven by Liberty Mutual and State Farm. State Farm remains one of most consistent spenders.

  • Google has it’s strongest spending week of the year. Are they looking to make up gains from small businesses? 

Other notable gainers: Clorox is back, indicating a return to store shelves. Home Depot and Lowe’s had big weeks, likely driven by the holiday weekend.


Keeping an eye on: When will these bellwether advertisers we believe are indicative of market health come back? Expedia, Pepsi, McDonalds, Fiat Chrysler, and Marriott. Are you seeing movement from any of these?
 

In case you missed Friday’s Webinar, there was extensive analysis of weekly advertiser data. Click here to see what was covered in the presentation.

Top Gainers and Decliners

41.png

Weekly Advertiser Gainers & Decliners 5.19

Advertiser Data: Biggest Movers

A Note About The Data:
In an effort to make this advertising data more actionable, we've created a longer view to better spot trends by category and advertiser. The goal is to provide a picture that encompasses pre-Covid activity. The longer term view enables you to better capitalize on opportunities as advertiser spend returns.

Below is a weekly view of the top 50 advertisers, based on spend, over the last 20 weeks. The right column compares last week to the average of the last 20 weeks.

At A Glance: 

  • 21 Advertisers are up Last Week vs. Average (20 weeks).

  • Notice AdWords is up and showing consistent growth in the past few weeks. We view AdWords as an indicator of auction pressure.

  • The Mobile & Wireless Category had a big week. AT&T is no longer social distancing.

  • This new view shows the extent of Auto’s drop, by far the biggest category for our BMX clients.

  • Adobe pops with their strongest week of the year with their push of the Creative Cloud.  Fingers crossed advertisers will be ready with post-Covid creative.

  • Eli Lilly, Sanofi up. GSK not spending. What are the “right” drugs to get advertising support now?
     

Keeping an eye on: When QSR will pop. We are calling Dunkin as the leading indicator of the market return. Commuters, limited drive thru’s, no current spending. Which advertisers are you watching?  (We aren’t holding our breath for travel)

New this week: Kick off your Memorial day weekend with some never before seen cuts of BMX data. Join our webinar on Friday at 1pm EST. If you haven’t already, register here.

Top Gainers and Decliners

40.png

Weekly Advertiser Gainers & Decliners 5.12

Advertiser Data: Biggest Movers

Below are the top 50 advertisers, based on spend, on a week over week basis. The second column shows last week versus the prior 28 days.

Reminder: While W/W is an indicator of an advertiser's spending, a longer view provides a better measure of their actual spending trends.

At A Glance: 

  • 27 Advertisers up W/W. Last week 19. 28 Advertisers are up over the last 28 days.

  • Adobe more than doubled spend over the last week. With marketing focused on their Creative Cloud, a new wave of ads may appear.

  • After a slow return, Insurance picking up with 5 advertisers gaining W/W, including Liberty Mutual, Berkshire Hathaway (largely driven by GEICO), and USAA

  • Disney, Microsoft, and Verizon maintain a steady climb upwards, unlike others in the top 50

  • Auto having another off week, with only Ford up W/W vs 5 advertisers up 2 weeks ago. FCA down big.

To note this week: Clorox makes an appearance in the top 50, a sign they may be back in the supply chain, or pushing other products?

Top Gainers and Decliners

39.png

Weekly Advertiser Gainers & Decliners 5.5

Advertiser Data: Biggest Movers

Below are the top 50 advertisers, based on spend, on a week over week basis. The second column shows last week versus the prior 28 days.

Reminder: While W/W is an indicator of an advertiser's spending, a longer view provides a better measure of their actual spending trends.

At A Glance: 

  • 19 Advertisers up W/W. Last week 24. 23 Advertisers are up over the last 28 days.

  • P&G picking up spend in the last 2 weeks a positive sign as the category leader attracts followers

  • Disney and eBay showing significant increases as consumer trends lean towards Entertainment, Online Shopping

  • Activision the largest gainer from last week, the largest decliner this week

  • After multiple weeks of increased spending, Auto was down with only Toyota up W/W 

Other notable W/W gainers outside of the Top 50 are Apple, Kroger and L'Oreal, all leaders in their categories and great to see spending.

Top Gainers and Decliners

38.png

Weekly Advertiser Gainers & Decliners 4.28

Advertiser Data: Biggest Movers

Below are the top 50 advertisers, based on spend, on a week over week basis. The second column shows last week versus the prior 28 days.

While W/W is an indicator of an advertiser's spending, a longer view provides a better measure of their actual spending trends.

At A Glance: 

  • 30 Advertisers up W/W. Last week 24. While the last 2 weeks have been a low point, 27 Advertisers are up over the last 28 days.

  • 5 Auto Advertisers are up (or flat) vs. 4 last week, with FCA being the biggest gainer again W/W

  • Wayfair and Johnson & Johnson up significantly, as Home Goods/ CPG return to the Top 15

  • Adwords up W/W, likely due to Small Business Credits from Google

  • Gaming and Computers up, with Activision being the highest gainer in the last week

Top Gainers and Decliners

34.png